 Facebook
 Twitter
 Pinterest
 Copy Link
Ambush Market Data Pop Quiz, September Edition
With all the great feedback from our previous “Ambush Market Data Pop Quiz!” video, we decided to make another one! Lots of great data and an e-scooter zipping along a peaceful Irvington streetscape.
If you ever have questions about current market trends and how they relate to your home, please give us a call!
Changing Markets Create Opportunities
There is a fundamental shift happening in the Portland real estate market where marketing times are expanding, buyers have a few more home choices (and time to think about those choices), and to get top dollar sellers have to rely on full-service agents to properly market their properties and reach the most buyers. The days of putting a sign in the yard and bragging about 12 offers in three days are over.
As the market shifts, opportunities arise. Right now is a great time for real estate investors to evaluate their current position. One metric that is still solid is prices. An owner’s investment property is worth more now than it ever has ever been worth. In this type of market, it is often a good idea for investors to consider a less is more strategy to increase cash flow.
Less properties can equal more cash flow?! Why yes, that is precisely what I am saying. Let’s take a look at this example:
An investor owns ten houses worth $350,000 each and owes $150,000 on each of those properties. That is $2 million in equity. Say that investor’s monthly cash flow (after expenses and debt service) is $600 a month on each property for an aggregate cash flow of $6,000 per month. That investor hires us to sell five of those homes for top dollar allowing them to pay off the five homes they still own which means they now have five houses free and clear worth $1.75 million. Without any mortgage payments, the investor’s new monthly cash flow would increase to $1,450 per unit or $7,250 per month. That is a 20 percent increase!
As investors ourselves, we always have strategies for our investor clients to maximize their returns. Call us today for a free consultation!
Closing Costs for Sellers

Lesser agents don’t discuss closing costs with sellers until the end of the transaction. Typically the conversation happens right about the time the seller receives their estimated settlement statement from the title company and see the thousands of dollars they are coughing up at the closing table. As you can imagine, it is typically not a pleasant conversation!
Generally, the closing costs to the seller will be less that 1% of the sales price. Laws, regulations, and customs vary by state and often by county but in Oregon most fees related to title insurance and escrow are regulated by the state. So these are not things sellers can shop around for to try and save a few bucks. As Realtors, we typically refer our clients to title companies and escrow officers that we know are great communicators and efficiently get deals done.
In Oregon it is customary for the seller to pay for the title insurance policy. The seller is saying to the buyer, “Mr. and Mrs. Buyer, I paid to insure that the property is free and clear of any liens and encumbrances that you don’t know about.”
Beyond the title insurance costs, there are escrow fees. These are expenses related to shuffling the paper around, getting signatures and recording the sale with the county. Oregon buyers and sellers typically split these fees 50/50.
If you ever have a question about how real estate transactions work, don’t hesitate to call us. With over 30 years of combined experience, we have you covered!

When is the Best Time to Buy?
The best time to buy is usually a year before you actually purchase something. The reason is that the greatest strategy to build real wealth in real estate is to buy and hold for a long period of time. It is almost a sure bet and below is a chart that I think really illustrates my point.

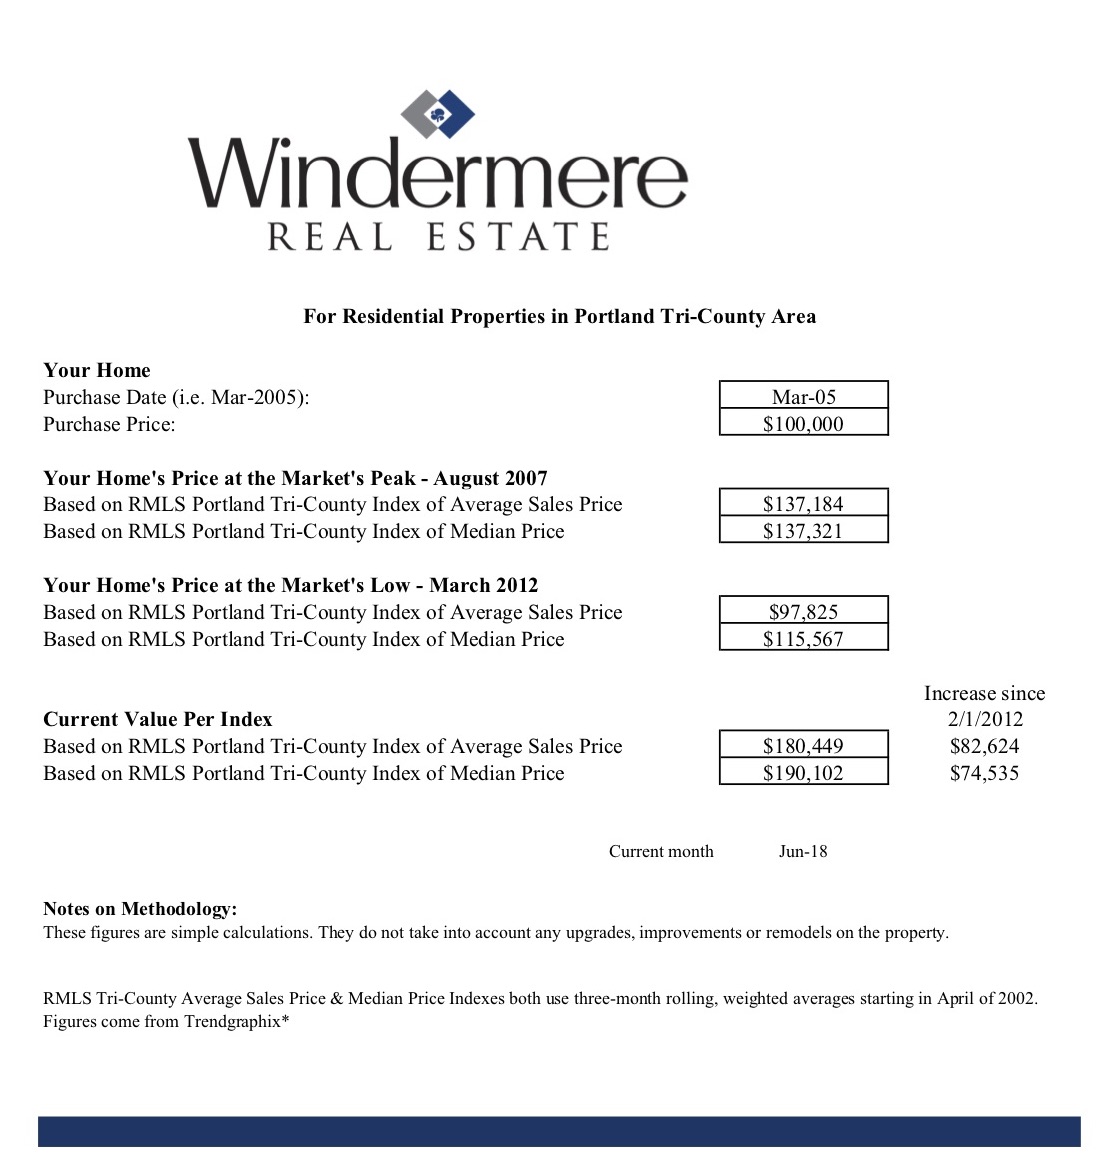
Let’s say a person purchased a hypothetical property in 2005 for $100,000, cash. This was the beginning of the run-up to the market peak and based on data from RMLS for the Tri-County area, by August 2007 that property would have seen a peak value of $137,184 and that buyer was feeling groovy.
Then we saw a total market crash and that same property’s value fell to $97,825 by March 2012. So that buyer is now super bummed, stressed, and feeling far from groovy. In their mind, they have now lost $39,359 in equity. But chin up! They actually only lost $2,175 in equity (purchase price minus current market value). And in terms of actual cash, they have not lost anything since they have not sold the home.
Today, this same house is now worth $180,449. This is 80% above the original purchase price, or about 4.6% annual appreciation. They feel groovy again! Even the folks that purchased at the peak of the bubble in 2007 are feeling groovy!
Current market fundamentals are strong. 30,000-40,000 people are moving to the metro area every year and we are still behind delivering new units since we had essentially zero new inventory during the lean years. On top of that prices are still increasing faster than historical averages and inventory is tight. So my answer to “when is the best time to buy?” Its when a person has their finances in order and are ready to call Carmel and me. Good ol’ fashioned time is the greatest hedge against market instability.
Ambush Market Data Pop Quiz!
Ambush Market Data Pop Quiz! Where Tyler put Carmel’s market knowledge to the test!
")

